1.1. Cloud Edition
Introduction
The Cloud Edition is the web based online Edition of LandlordMax which you can access from any computer with an internet connection.
Along with being web based the new Cloud Edition also offers a number of new major features that aren't available in the installed Editions. These new features include small things such as the ability to search on any column in all the tables to major new features such as being able to create your own custom reports and printouts!! Below is a quick highlight of some of the more important differences to make your transition as smooth and easy as possible (explained in more detail in the next sections):
- Ability to edit in the tables directly
- Searching and filtering on ALL columns
- Ability to create custom reports
- Many new reports
- Completely redesigned Profit & Loss reports
- Very significant performance improvements
- Built-in word processor
- Greatly improved Automations
- Multi-user support at no additional costs
- And so on...
The link to the new Cloud Edition is https://app.landlordmax.com
Please note that although the software works on mobile devices such as iPads, etc. that we do NOT yet officially support mobile devices because the screens are not optimized for smaller displays such as an iPhone or Android phone. The software officially supports Windows and Mac OS X computers. That being said our goal is to have full mobile support in the near future.
The price of the Cloud Edition is going to be $1 USD/unit/month with a minimun of $10 USD/mth. You can however run it on as many computers as you wish. If you very recently purchased the software please contact us as it may be entitled to receive a credit towards the Cloud Edition (credits are based on the date of purchase and units managed within the software). That being said we are offering a 30 day trial to the Cloud Edition to everyone! Just keep in mind however that any work done in the Cloud Edition CANNOT be transferred back to the other Editions such as the Desktop Edition and so on therefore if you decide to stay with your current Edition instead of the Cloud Edition you may have to re-enter the same data in your current Edition.
And without further ado here is the details list of new features in order that you're most likely to encounter them.
Dashboard

When you login for the first time you'll notice that you're immediately presented with a Dashboard screen, which is the first new feature you'll see of the Cloud Edition. The Dashboard contains a 12-month trailing Profit & Loss chart at the top to give you an idea of the performance of your portfolio.
Below the chart you'll find a small list of Notices. Although we expect to add new types of notices in the future there are currently 6 types of notices you can find in the Notices table. The first two are basic LandlordMax notices (basically important messages from us). After that the remaining Notices are all about your portfolio, ranging from late payments, expiring leases, vacancies, and new tenant's moving in notification.
Navigation
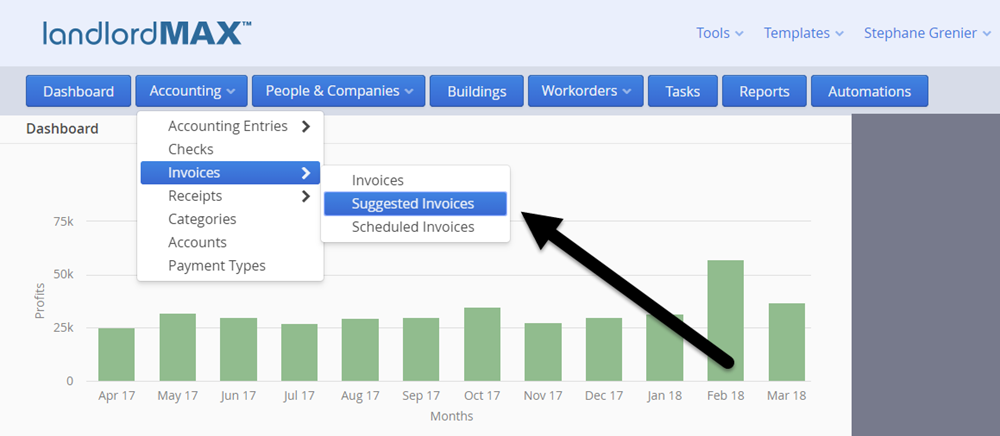
The next thing you'll probably notice is that the navigation buttons have been moved from the left side to the top of the screen. This is because we've been able to take advantage of how websites work to improve the navigation of the system. The main sections and actions are found at the top through the blue buttons.
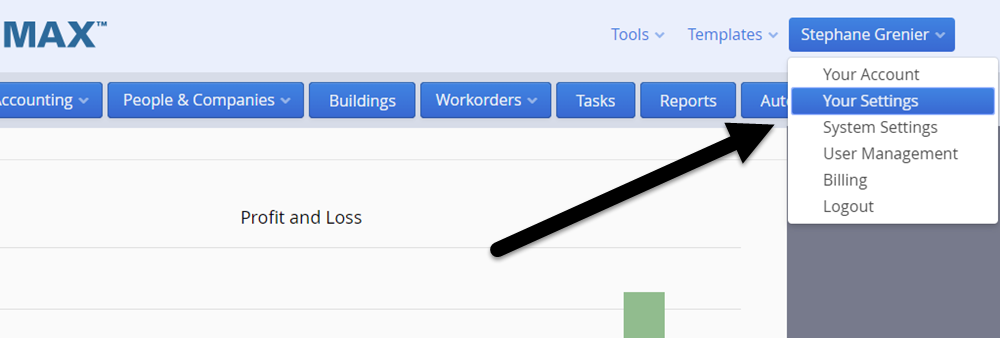
The preferences and other related items you change less frequently are found on the top right under your name (the logout is also located here). The import/export for QIF files can be found under the Tools menu. The Templates is a completely NEW section and it's where the system and report templates are located. This is where you can create your own custom reports as well as edit the system templates such as the workorder template, the invoice template, and so on !!! This will be covered later on. In essence not only can you manage and customize your reports but you can also customize the invoices, receipts, workorders, etc.
Please note that report customization does require some technical knowledge of html/css as well as the templating engine. For those of you who are already famliar with html/css you will find the templating engine easy to learn because the biggest challenge is knowing html/css. You can also work with your own local webpage designer to customize your reports, system templates, etc. since it's the same technologies used to create webpages. And for those who are not familiar with html/css, don't have a website designer, or would just rather have us create the custom reports for you, we are now offering consulting services to help you create custom reports and templates.
Tables

The Cloud Edition expands the power of the tables by adding searching/filtering on ALL columns in ALL tables in the software where appropriate. In other words you can now search by any column for any data. You can search for any part of the data. For example if you just know the firstname of the tenant you can search by the tenant's firstname. In the screenshot below you can see it seaching/filtering the fields so that only Accounting Entries with the word "Fee" in it appear in the table. And yes you can search/filter by multiple columns. In some cases such as dates the software allows you to set a date range, so for example you can limit the data to just today, this week, this month, last month, this year, and so on.

You can find the actions to perform on the right side of the screen. So for example if you want to create a new Accounting Entry you can click on the New button on the right. If you want to enter in a Partial Payment for an existing entry you first select it in the main table and then you can just click on the Partial Payment button and the software will proceed to enter in a partial payment for you. In some cases where you want to perform the action on multiple items all at once you can select them by clicking on the checkbox on the left of the table.
And just like the Installed Editions (Desktop Edition, Soho Edition, etc.) the software will remember which columns you selected, the widths of the columns, and so on. The software will remember everything except the search/filtering values because it doesn't make sense to remember these long term (for example if you search for the amount 56.32 you probably don't want to limit the entries to that amount the next time you go to the accounting table).
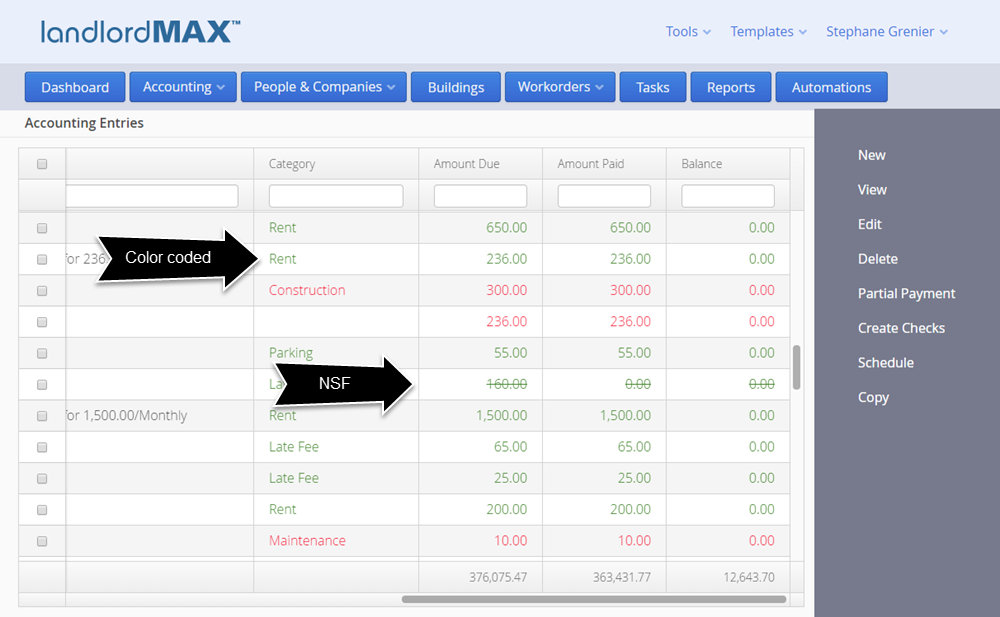
You can also expect the entries in the table to remain color coded. In the case of the Accounting Entries the amounts are color coded based on whether the entry is a revenue or an expense. The Cloud Edition also now puts a strike through NSF entries to show that they are NSF and not added in the totals. Please note that in the Cloud Edition there is a new NSF checkbox rather than you having to enter in NSF for the Amount Paid.
Table Editing

A major new feature in the Cloud Edition is the ability to edit entries directly in the table. To edit an entry you can just doubleclick on the row you want to edit. The software will then give you the ability to edit the values for that row. *Please note that some values may not be editable depending on column and table (For example you cannot edit the amount for a receipt directly in the table because the amount is calculated based on the line items and not an entered in value. You also cannot edit the notes column on most tables because the notes is a big text box that would not fit in the row editor). Once you've made the edits you wish you can then either click on the Save button to save your edits or you cancel them by clicking on the Cancel button (the Escape key will also Cancel your edits).
Data and Form Screens are separated
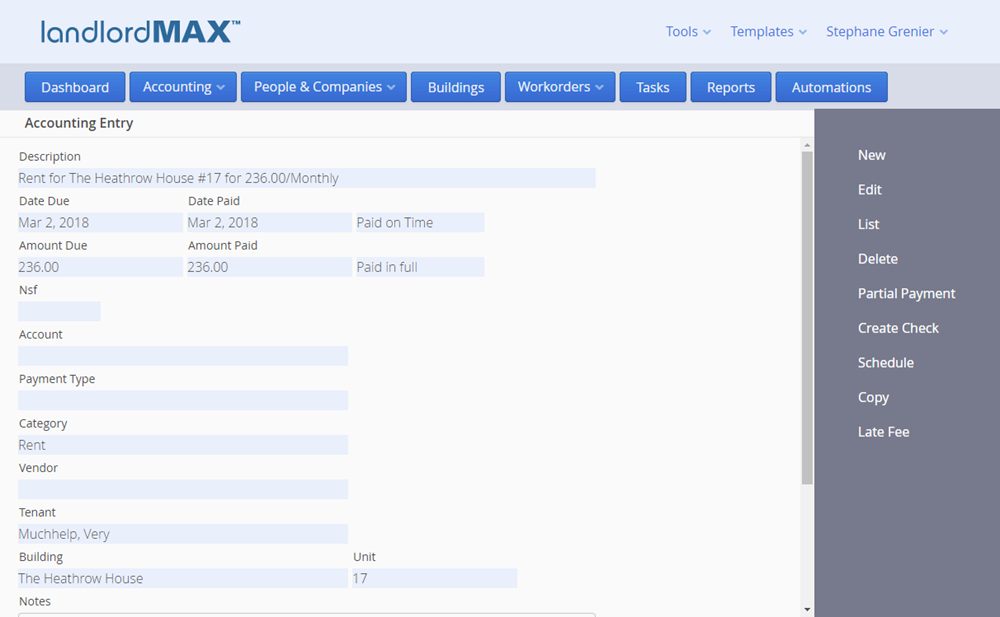
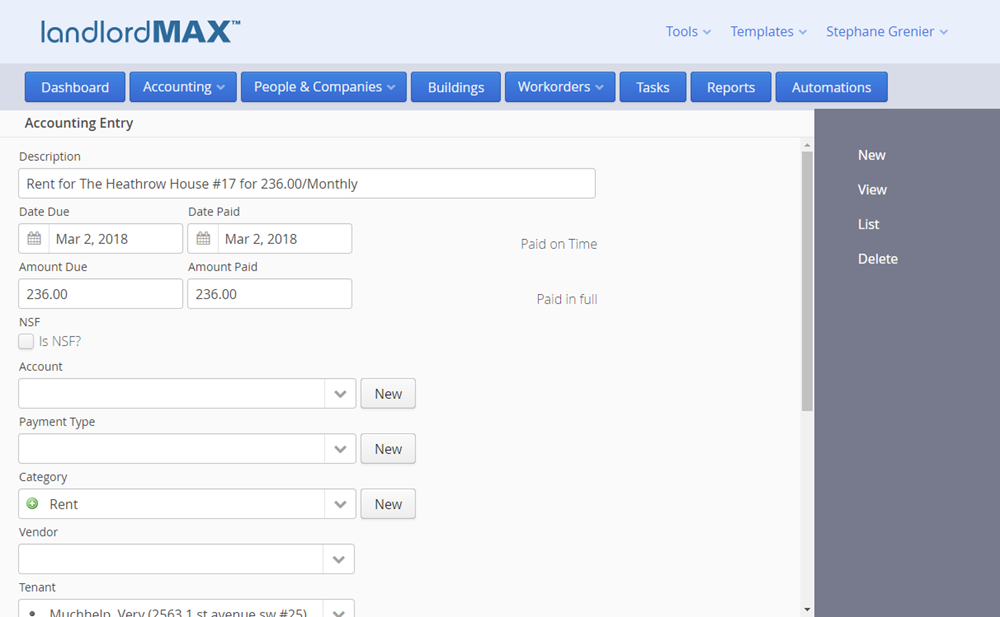
New to the Cloud Edition is that you now have a Data View and a Form View. In other words instead of always having a form like you currently have in LandlordMax you have the ability to decide if you want to view a data item such as Accounting Entry, a Tenant, etc., or if you want to edit it. The data view includes not only the data about say just the tenant, but also the tabbed panels from the Installed Editions whereas the Form View limits you to only editing the data about that specific form. This has been done to reduce the number of potential conflicts for multi-user systems and to streamline your workflow.
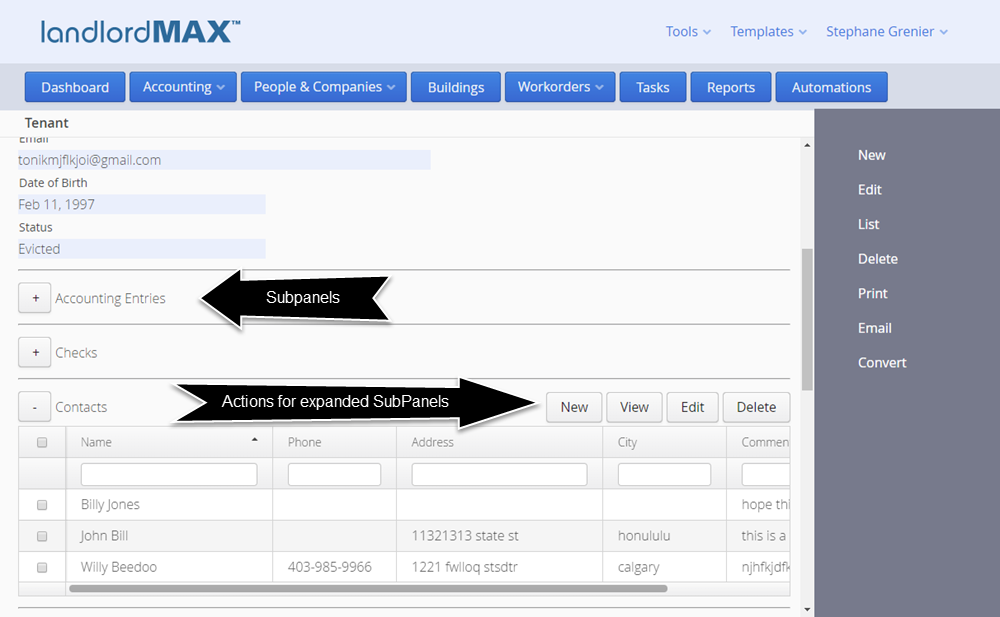
The next big improvement with the Cloud Edition is the tabbed panels. In fact they are no longer called tabbed panels but rather they are now called SubPanels. The reason being is that instead of tabs we've added them as SubPanels so that you can open and view multiple SubPanels at the same time. For example the above screenshots show the Tenant's Data View with the Tenant's Contact SubPanel open so that you can see all their Contacts. Keep in mind that as these are tables you can again select which columns to display, search/filter on any column, edit the entries directly in the table, and so on. And again you can have multiple SubPanels open at the same time.
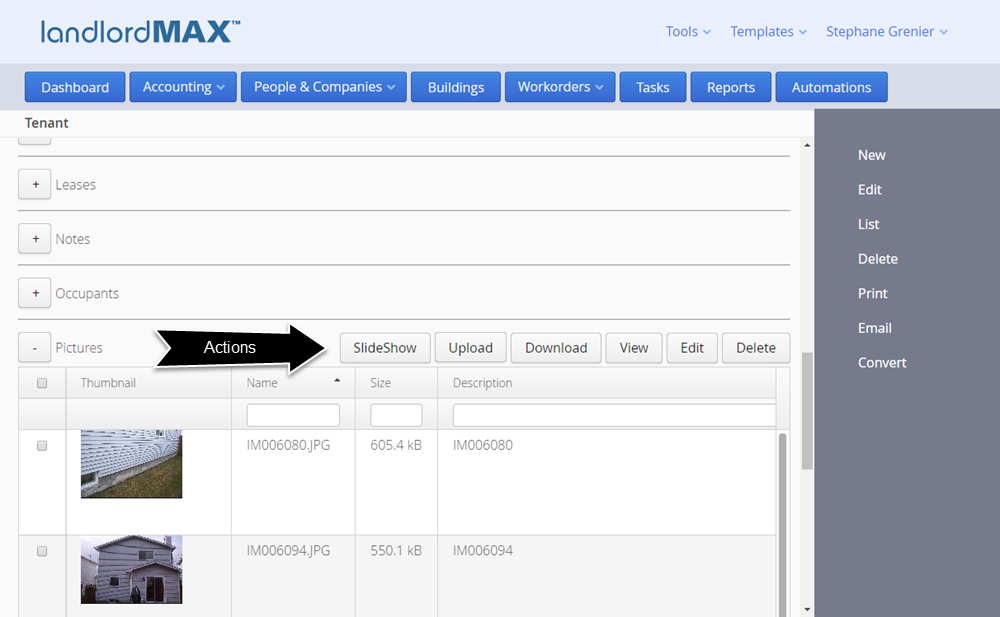
You can find the actions you can perform for each SubPanel just above the table for that SubPanel (as shown in the above screenshot). You can for example create a New Accounting Entry right there and it will bring you to a new Accounting Entry Form, in this case with the Tenant already selected for you.
Some SubPanels have additional actions such as the Documents and Pictures. In the Pictures SubPanel you can upload new pictures, view a slideshow of the pictures, and so on. In fact we've improved the ability to export pictures in that instead of having to export all pictures you can select which ones you want to export and the software will package them all together in a zipped file for your convenience.
Built-in Word Processor
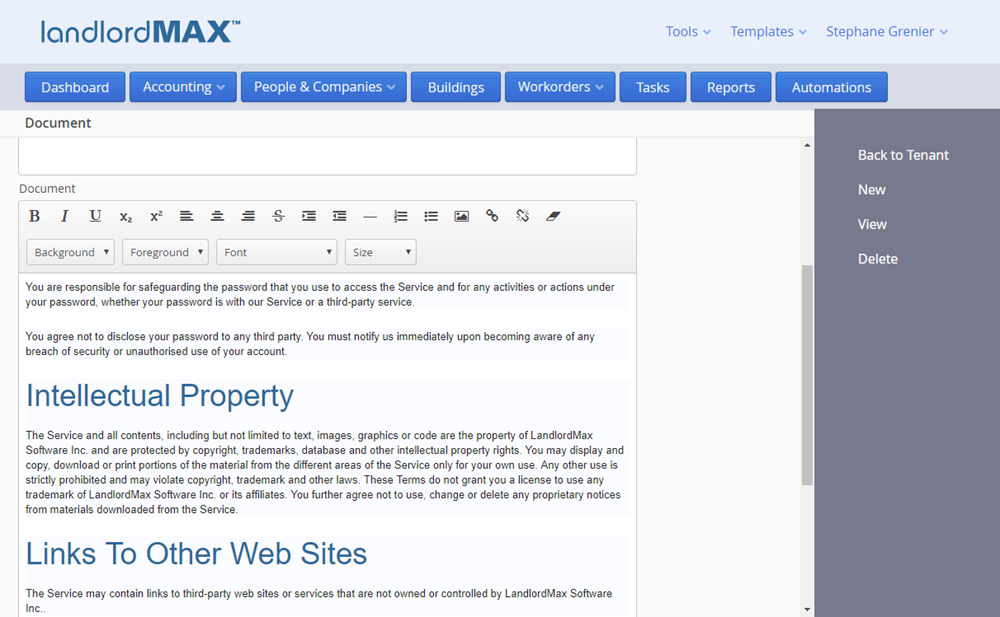
The Cloud Edition introduces a built-in word processor for you to help manage your documents, lease agreements, etc. You can of course continue to store existing PDF and DOCX document files, but in addition there is a new LLMAX document type which you can use within the software. When a LandlordMax document is emailed it is converted to a PDF so that the recipient can view just like any other file without needing any special software. The main benefit of this new document type is that you can store, manage, and edit it directly within the software system.
Reports
Custom reporting is going to be covered in the next section, but before we get to custom reporting it's important to cover how the new reporting system works.

When you first enter the new reporting system you will be presented with a drop down menu to select the report you want to run. You can use either the mouse to select from the list of available reports or you can also just start typing in the report name and the software will start to filter the list of available reports based on what you type.
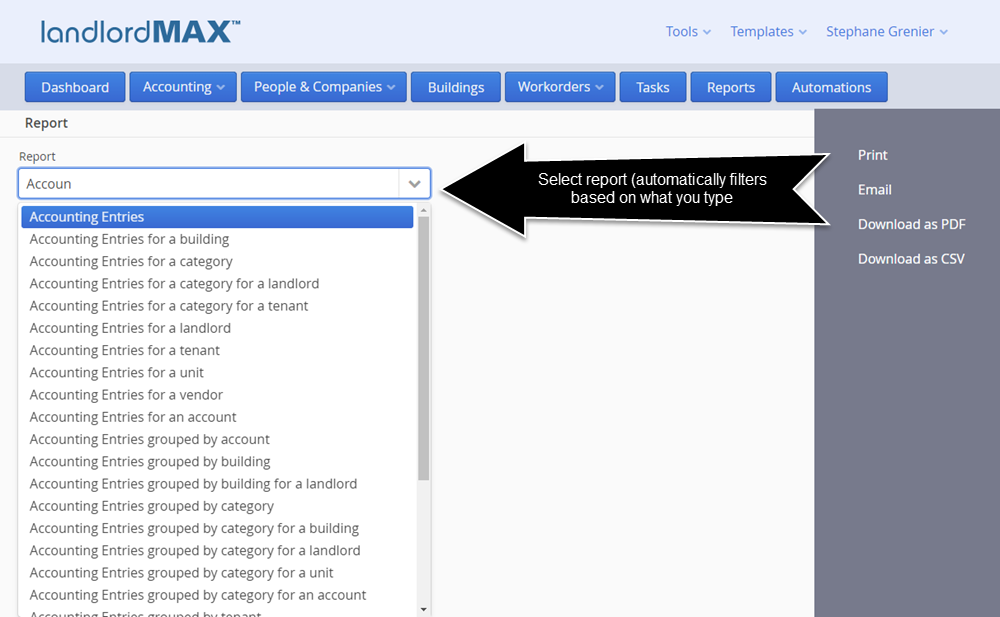
The list of report is directly taken from your list of Report Templates under the Report Templates menu (explained in the Custom Reporting section). Because you can now create and/or customize your own reports this means you can also edit and modify the default reports that come with LandlordMax to be exactly what you want. In other words the Report Names can be adjusted to your liking.
By default the software will provide you with all the reports from the Installed Editions with a few changes. First we've added several new reports including accounting reports based on payment type. But much more significant the Profit & Loss and Cashflow reports have been combined into a much more comprehensive Profit & Loss report where you can view the changes on a monthly or yearly basis (more on that later). The new Profit & Loss report was designed based on feedback and requests from you.
In addition the reports themselves have all also gotten a major facelift. One of the biggest change is that the reports now wrap the text in the columns if there isn't enough space for the information to fit in a column rather than end with the three periods. We've made this change again due to feedback from you.
By default your letterhead will continue to be included in all reports, but again since all reports are completely customizable you can decide whether or not you want this option. *Please note that you need to include the token ${letterhead} for the letterhead to appear in your report (explained in the Report Templates section).
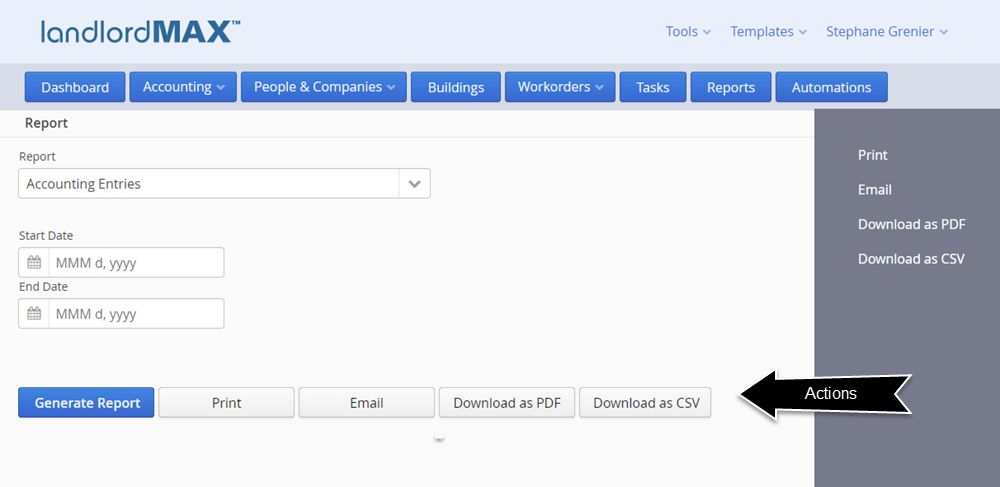
All reports can be emailed, printed, downloaded as PDF files, or downloaded as a CSV files. The CSV file export has been completely re-designed to make it much more intuitive and simple. Not only that but the CSV export feature now includes all appropriate data for each row rather than just what's included in the report. In other words you will get the full data on the CSV output, not just the data for each column but all possible columns, even those not included in the actual report.
As part of creating your own custom reports you will also be able to pick which values are used to generate the reports. For example in the above screenshot the Start Date and End Date are defined by you as part of creating your custom reports. In other words you select the criteria for the report, whether it's a date range, a specific tenants, only current tenants, etc. Everything is controlled by you.
You also control if there is a chart in the report design therefore there is no longer a need to select the type of chart, this is all defined in the report setup.
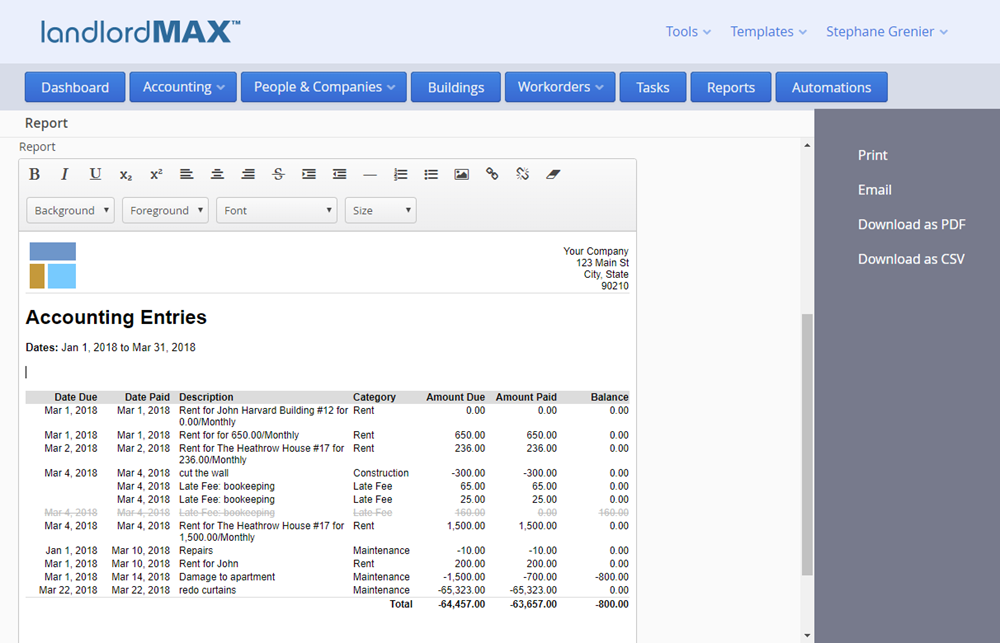
The generated report will then appear in the built-in word processor just below the action buttons. In the above screenshot we can see that we ran an accounting report for the first quarter of 2018. Although the data is very limited so that we can make the example easier to understand, notice the greyed out line. By default NSF Accounting Entries now appear as grey out line items in the reports and are NOT added to any of the totals. You can of course customize this but by default this is how they are now treated.
Because the report is generated into the built-in word processor this means you can now do some post report generation editing before printing, email, etc. the report. You can add a special comment at the top, at the bottom, and so on. You can adjust how the report looks. You can basically do any post editing you wish. ***Please note that this is a word processor and NOT a spreadsheet therefore if you adjust any of the numbers the totals will NOT be recalculated, just like if you edit a value in a Microsoft Word document. Again this is a word processor document and NOT a spreadsheet.
In any case now that the report has been generated you can make any post processing edits and they will appear in the printout, the emailed PDF, and the downloaded PDF. Please note that NO edits will appear in the CSV file because this is the raw data for the report. Screenshots of the print, download, email, etc. have been omitted as they are fairly standard looking web based interfaces.
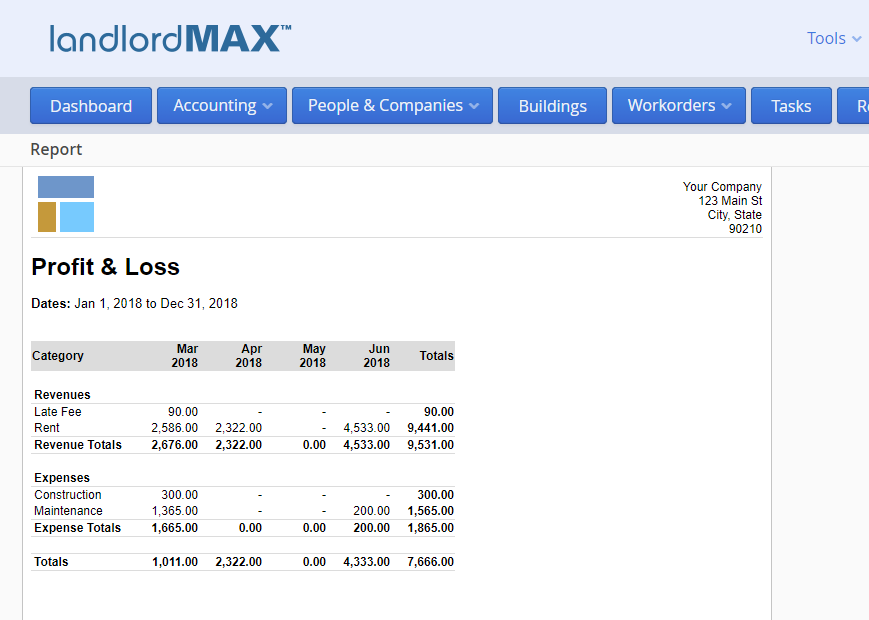
There are 10 different types of reports you can generate. They are: Accounting reports, Profit & Loss reports, Check reports, Lease reports, Rent Roll reports, Security Deposit reports, Tenant reports, Vacancy reports, Workorder reports, and Landlord reports. Each type of report has different capabilities. As mentioned earlier the Profit & Loss and Cashflow reports were merged into a new Profit & Loss report format which you can see in the above screenshot. As you will quickly notice you can now easily compare the different totals over time. The above report is very small to make it easily fit in the screenshot but it can be quite comprehensive depending on your data.
Another change to the default reports is the Tenant Statement. The Tenant Statement report now includes both what has been paid AND what is still owed, and separates the two lists so that it is obvious what is outstanding in the SAME report. As part of overhauling the report system we have also done some other minor improvements to other reports and added some new reports.
Automations
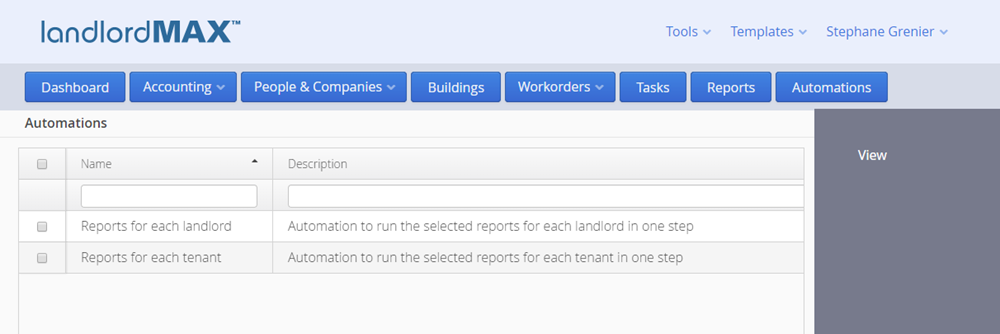
Another section that has had a major overhaul is the Automations section. Currently we offer two Automations but expect many more to come in the future. They are they ability to run the reports for all your tenants or landlords in one step rather than having to run them one by one for each tenant or landlord. In other words if you want to run a report such as the Tenant Statement for all your tenants then you can run generate all the Tenant Statement reports in one single step!! The same is true if you're a property manager or property management company where you need to run reports for all your clients (landlords).
**The great benefit of the Automations is that it is able to pick up your relevant custom reports and include them within the list of reports you can automate.
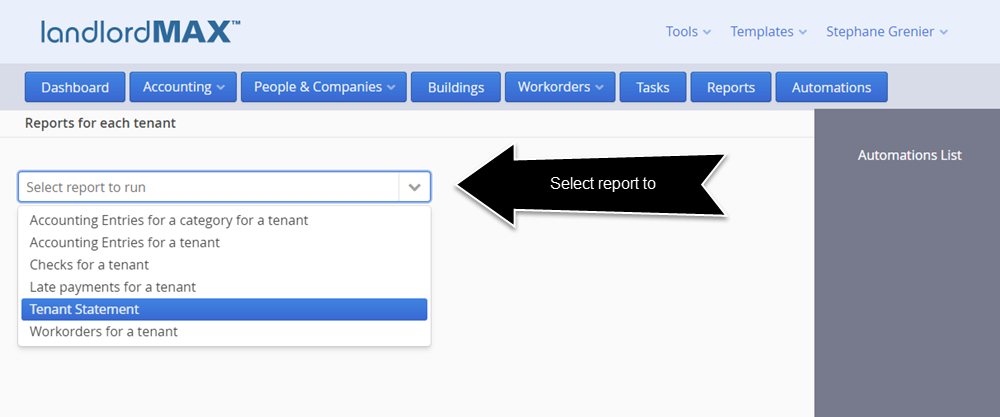
The above screenshot shows the default reports that can be automated for your tenants. The default list of reports for landlords is about 5-6 times more extensive because there is a variation of almost all reports available for the different property owners needed by property managers and property management companies.
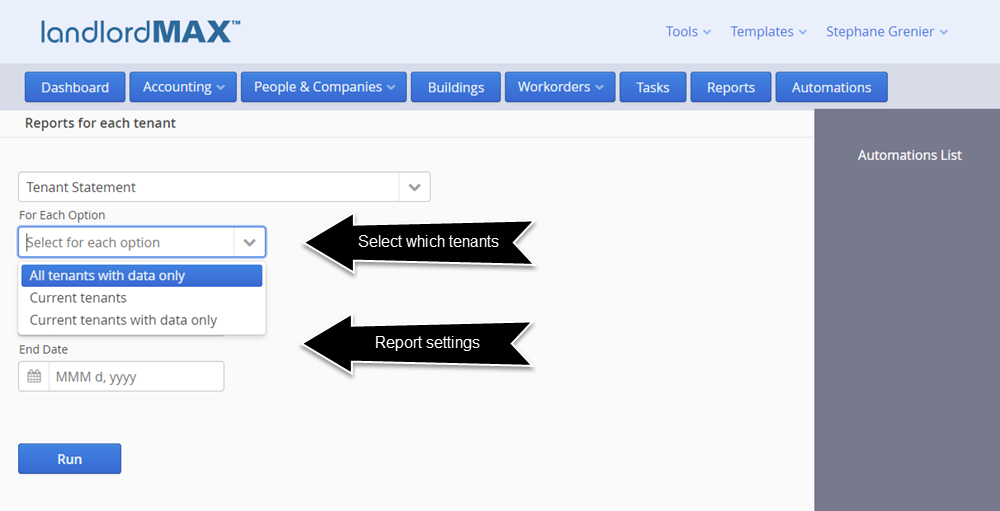
Using the Tenant Statement as an example you will then be presented with two sections of options. The first section is where you select the report and which tenants will be included for the Automation. The default and recommended setting is "All tenants with data only" which means the report will only include reports which have data. In other words if a tenant has no information within the specified report settings then it will not be included in the outputted reports. This is very helpful because you only generate the reports you need and don't have a lot of extra reports that have no value. We have included additional settings due to feedback and feature requests but please note that if you select Current tenants that if you have a tenant that has moved out but still has data they will NOT be included in the generated reports, hence why we recommend the default settings of All tenants with data only. It's very easy for a recently moved out tenant to have data but not appear if you limit the Automation to only current tenants. The second section is the specific report's settings that have to be configured for the report.
The email system has been completely re-done for the Cloud Edition because the Cloud Edition is an online web based service. The software can no longer rely on connecting to your email account directly and using it to send emails. This is just not feasible in a cloud based system, there are too many security issues. With installed software such as the Desktop Edition your computer and IP address have most likely already been approved by your email service but our servers have not (for each of your accounts). But not only that, and more importantly, many freemail services such as Gmail, Hotmail, Yahoo, etc. have limits on the number of emails that can be sent from specific computers, and if everyone is trying to send emails from the same freemail services then the limits will be quickly reached and emails will be blocked. This is in addition to a number of other technical and security issues if we tried to send emails from your accounts directly.
Therefore we are now offering two options for email delivery. The default option is included as part of the Cloud Edition and will result in all emails being sent from our email servers on your behalf. In essence they will look and behave as though they were sent by you but under the seams the emails will be coming from our LandlordMax email system. The reply email address and the display name will be yours and everything will appear to be from you for all intents and purposes, even if the emails are sent from us on your behalf. Your tenants, landlords, etc. will not see the emails were sent from us on your behalf, they will instead see that the email came from you and when they click on reply they will reply to your email address directly.
With that in mind there are going to be caps on the total number of emails you can send per day. This is standard of almost all email services, including all freemail services such as Gmail, Hotmail, etc. Generally most freemail services have caps of about 200-250 emails per day. Our email caps are based on the number of units your account is setup for, keeping in mind that the price is per unit. Most people should not reach anywhere near the limits but we felt it is important to state just in case some people decide to start mass emailing out thousands of potential tenants, for that you'd need to use your own email service/account outside of LandlordMax.
That being said we are going to offer an add-on email service for those who want both whitelabelling and higher email caps. In other words if you wish to have all emails sent from your own email address (whitelabelling), that is the from email address is also yours, then you can decide to include the add-on email service starting at $50/mth (price is dependent on portfolio size and number of expected emails). Please note that this service is NOT available for freemail accounts (Gmail, Hotmail, etc.) because it requires you have control of the domain from which the emails are sent because you will be required to add three CNAME entries to your DNS records. This is required so that we can guarantee high delivery rates with whitelabelling, and in fact you will most likely see a much higher than your current email delivery rates.
System Templates
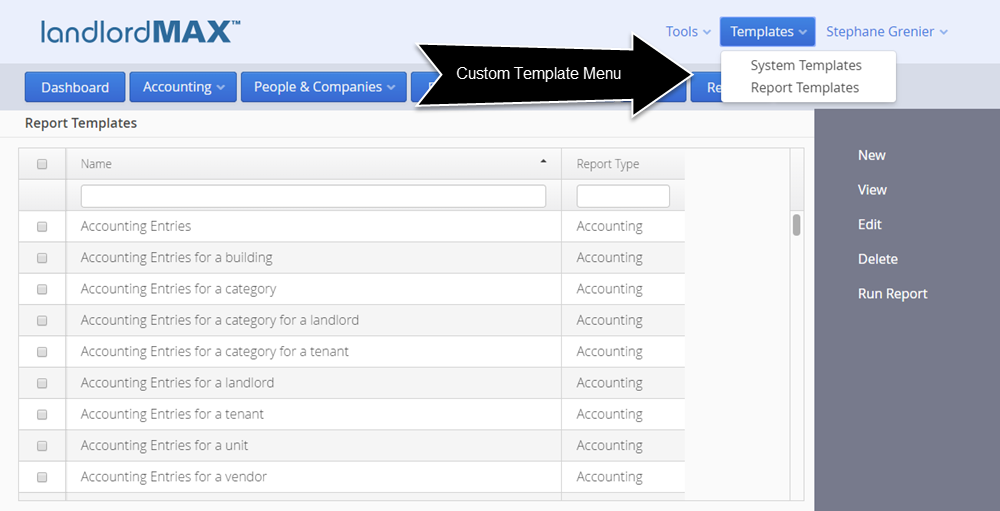
The next biggest feature of the Cloud Edition is the ability to create your own custom reports and system templates (workorders, invoices, etc.). You can find all the System Templates (Workorder, Invoices, Letterhead, etc.) under the System Templates menu and all the Report Templates under the Report Templates menu. For simplicity we're going to cover System Templates first as this is the simpler of the two templating systems.
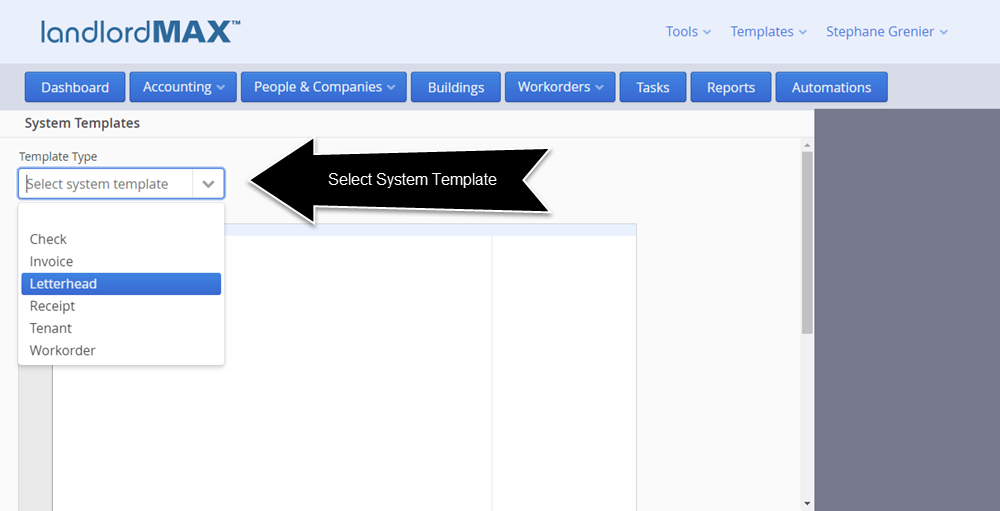
When you first arrive at the System Templates screen you will be asked to select which System template you want to edit. All the System Templates are similar except for the Letterhead because the Letterhead doesn't require the reporting engine. In other words the Letterhead System Template is just html and css therefore you are presented with two options to view the template, either in the built-in word processor or as html and css source code. We recommend the built-in word processor for those of you who are less technical.
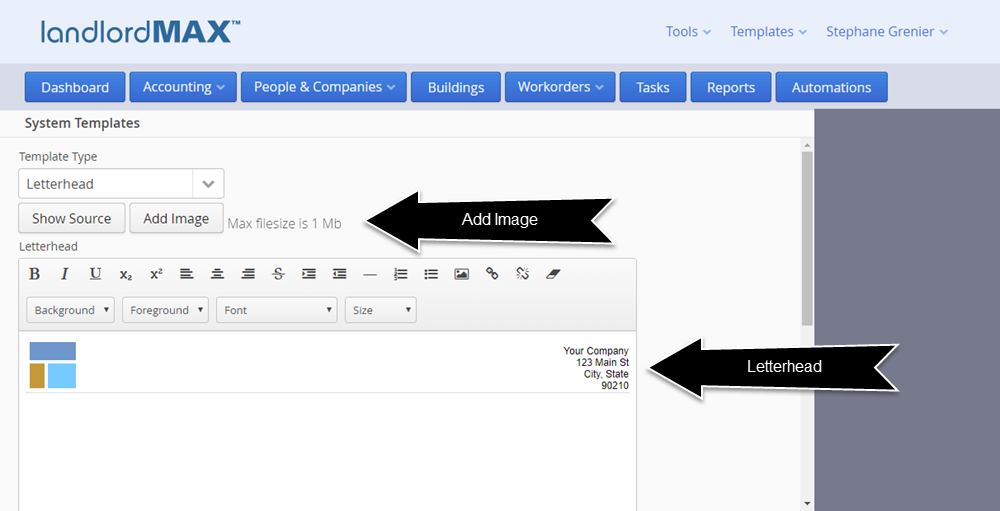
Just below where you selected the Letterhead System Template you can see two buttons. The first is Show Source and this allows you to view the Letterhead as html and css rather than work in the built-in word processor. This is generally either for people who are more comfortable working in html/css or for when you are trying to do more advanced formatting.
** For existing customers who transition to the Cloud Edition the transition software will try it's best to convert from the previous single image letterhead to this new html/css format. Please note however that we do NOT guarantee the result, this is a best attempt effort as some people have very complex letterheads and as a result you may have to adjust the letterhead or re-implement it. If your letterhead is more complex or you wish to improve it then you can either hire a local webpage programmer or look at our consulting services. Please also note that in some cases the software may deem it not possible to convert your letterhead as part of the conversion process due to the complexity of your letterhead at which point you will need to convert the letterhead yourself.
Getting back to the Letterhead Template if you wish to include an image you need to click on the Add Image button which will allow you to select an image. Please keep in mind that there is a total 1mb size cap for System Templates therefore it is important that you keep your logo images compact in size, which is expected of letterheads anyways.
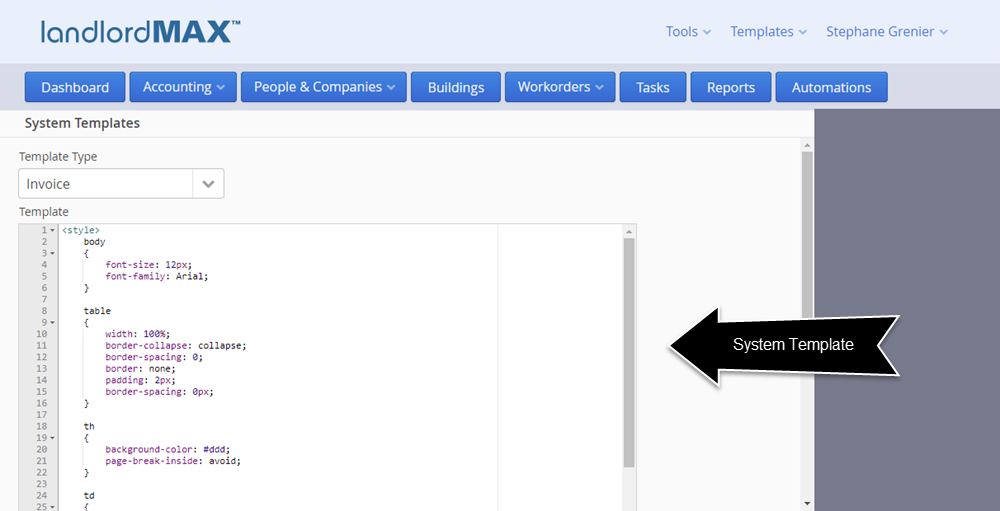
All other reports are coded in a combination of html/css and the Apache FreeMarker. In essence Apache FreeMarker is a template engine which allows you to replace certain tokens with their actual values. So for example for the invoice template the token ${invoice.landlord.name} is replaced with the landlord's name (for that invoice). Another example would be ${invoice.startDate?date} which replaces that token with the invoice's start date. You may have noticed the additional "?date" at after the Start Date, this is required by the template engine so that it knows the value is a date.
This section is only going to briefly cover the templating system, the full documentation is going to be available with the full public release, therefore if you're going to edit any System Templates we do ask that you do so carefully, and preferably make backups before starting. We can of course assist you if there are issues but please keep in mind that free technical support is going to be limited when it comes to customizing System Templates and Reports. If you wish to have more involved assistance we will of course offer consulting services, but due to the fact that this is a form of programming and that it is possible to create incredibly complex reports, we do have to limit what is included with free support. To give you an analogy it's the same as buying Microsoft Word and asking Microsoft to help you write your novel. We will do our best to assist you but we cannot write your novel for you, that falls under consulting services. And of course you can always work with local talent, there are many webpage designers who can assist you in creating your own custom templates.
Getting back to the templating engine, all values for the templates are what you see on the screen. So for example if the Data View (or Form) has a field called "End Date" then that value will be available in camel case, which means that "End Date" would be "endDate". If it's the value to another item, such as an invoice, then it will be invoice.endDate (the two are linked by a period).
To keep this document simplified we'll refer you to the Apache FreeMarker documentation on how to display lists of data and so on (for example lists of accounting entries) as well as conditions (for example if an accounting entry is NSF), etc.
*Please keep in mind that if you change a System Template that you may need to reload the page to have the System Template updated. In other words if you edit the Invoice System Template and you're on the Invoice screen you may need to reload the Invoice screen to see the new Invoice System Template changes.
In addition to the above the software always includes the Management Company information and Letterhead template within the System Templates in case you need to use these values. So for example in the default Invoice System Template there is a check to see if the Management Company has a name or address, and if so then it will use the Management Company settings otherwise it will use the Landlord for the From section of the Invoice. In any case the Management Company and Letterhead is always provided to the System Templates.
As well the software has some additional hooks so that your date format preference is always used for all dates in the System Templates and Report Templates, which means you don't have to specify your prefered date format in any template. Similarly we've created some helpers such as LandlordMaxCurrency so that the numbers are all nicely formatted as currency values. You can of course choose to do something different but by default these have been added for your convenience.
Report Templates
** Please note that the intention of the release notes is to give you a quick introduction to new features and not to be a full user manual. More information and details will be provided in the user manual when the Cloud Edition is publicly available.
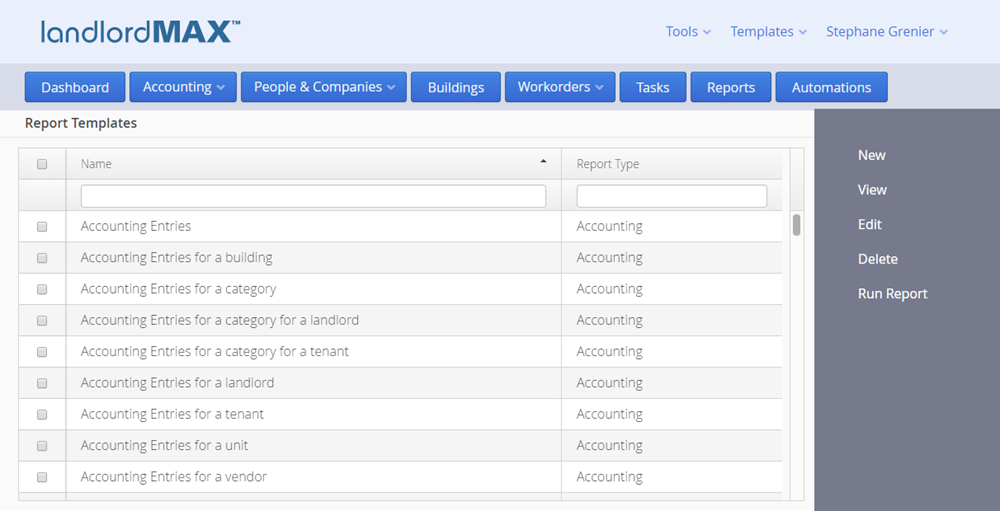
When you first enter the Report Templates section you will be presented with a list of all available reports. The Report Templates are very much the same as your Accounting Entries, Tenants, etc. in that they are data that you can select to edit, view, delete, create new entries, and so on.
Again there are 10 different types you can generate. They are: Accounting reports, Profit & Loss reports, Check reports, Lease reports, Rent Roll reports, Security Deposit reports, Tenant reports, Vacancy reports, Workorder reports, and Landlord reports. The second column shows the Report Type. Each report type has different capabilities. For example the accounting reports will provide you with lists of Accounting Entries based on the report settings. Conversely the Lease reports will provide you with a list of Leases based on the report settings. And of course each type of report has different settings. For example for the Accounting Entry reports you can ask the person to select a Category whereas for a Lease report you can ask them to select a Lease Begin Date. It's not just select but you can also define for example if the Lease Begin Date should be equal, greater than, less than, and so on (for example a Start Date). You can label the report settings to be whatever you want, such as Start Date, End Date, etc., it doesn't have to be the same name as the setting. Lastly you can also define how the report data is sorted, that is by which property (date, amount, name, etc.).
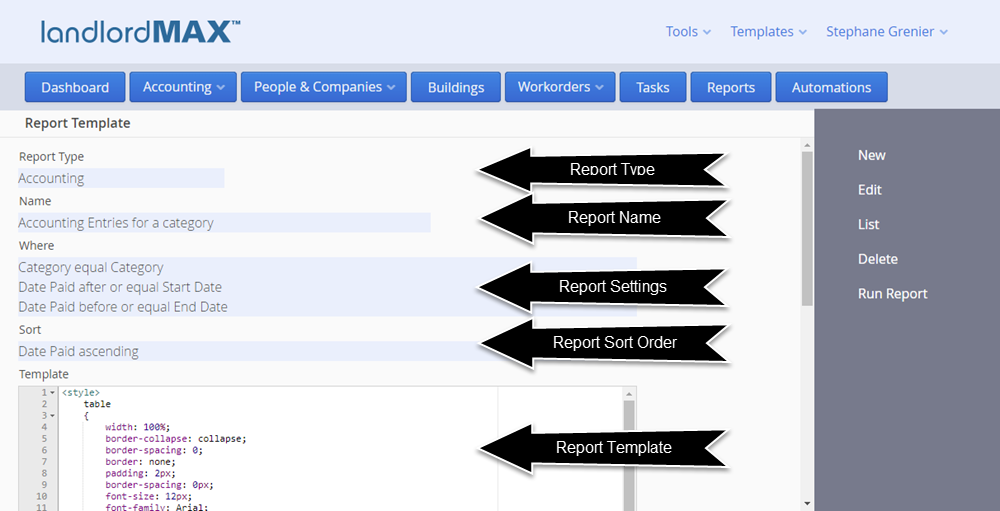
When you click to view a report you will be presented with above screen which consists of several sections. The first section Report Type tells you the type of report, which in the example above says that this specific report is an accounting report.
The second section, Name, is the name you assign to this report. This is the name that will be used in the report menu when you go to select which report to run.
The next section called Where is the report settings. Keep in mind that this is the data view from a saved Report Template, in essence this is the list of reports settings for this report. Therefore in the example above to run this report you would need to select three report settings. The first is which Category for the report (hence the name Accounting entries for a Category). Each setting shows the setting on which the condition is applied, the condition, and lastly the setting name. Using the second setting we want all Accounting Entries that have a Date Paid after or equal to the Date value entered (which is label Start Date). The third setting states that the Date Paid for the Accounting Entries must be before or equal to the date entered by the user (labelled as End Date).
And finally we have the sorting options. In the example above we just sort by Date Paid so that the Accounting Entries are ordered by the date they were paid. You can sort by multiple items, for example first by date and the amount, the sorting options are up to you. If you want to generate a report grouped by something report you will want to first sort by whatever is grouped. So for example if you wanted the report above to be grouped by Category you would first sort by Category so that all Accounting Entries for a Category are grouped together.
Then depending on the type of report you may have a Chart Type where you can select to include a chart. This option is only available were appropriate and what is charted is based on the type of report as well as what type of chart is selected.
Lastly you have the actual html/css and templating code to generate the report. For the purposes of the Release Notes we're just going to do a cursory coverage of the Report Template code.
That being said the code for the above report first consists of all the css styles. Any webpage designer should be able to understand and modify css styles. Following the css styles and some basic html you will find the first interesting bit of code which is ${letterhead} The code ${letterhead} is a placeholder (also known as a token) for where your letterhead will be placed in the report (the letterhead comes from the Letterhead System Template).
The next interesting tidbit (after some more html) is ${category.name} The software will include all report sections from the report as their own item. Since we have asked for a Category to be selected the Report Template will include the selected Category using the label we defined (which in this case is Category but had we named it "My Category" for example then it would be myCategory.name). You can then select what properties you want to display in the report for the selected Category. So for example if we wanted to display the description instead of the name we would instead use ${category.description}.
Just a few lines later we see the report setting dates displayed. Keeping in mind that we use the label, the dates are displayed using ${startDate} and ${endDate}. The exact code is: <b>Dates:</b> ${startDate} to ${endDate}<br/> The <b> is to indicate bolding and the is to guarantee a space (<b> and is html code).
Moving on the next interesting part piece of code is ${chart} which is the placeholder if you selected to include a chart in the report. You can only include this placeholder if a chart is selected for the report. The software will replace the placeholder ${chart} with the report generated chart.
We then move onto the <#assign> tags which is part of the templating engine. <#assign> basically allow you to assign values to variables. In this particular report we create two variables, one called amountDueTotal and another called amountPaidTotal, and we initialize them to 0. These variables will be used to calculate totals for the reports.
Since this is a list of accounting entries we then create an html <table>. Yes it is possible to use <div> tags but we do recommend using tables as the html rendering engine supports a subset of css styles and elements for security reasons. For example you cannot include Javascript code within the Report Template for security reasons. Similarly the functionality of <div>'s is limited for security reasons.
Once the table header has been defined we then start to loop through the list of Accounting Entries with <#list accoutingEntries as accountingEntry> For all accounting reports you will be provided with a list of accountingEntries generated from running the report with your settings, which in our examples means accountingEntries for the selected Category with the Date Paid between the Start Date and End Date. We use the "as" option to make it easier to read the template code. In programming you generally need to define the scope of items, in this case the loop, and to do this you add </#list> to indicate that everything between these two items is to be generated for EACH Accounting Entry in the report.
The next lines may seem to be complicated but once you understand them they're a lot less complicated. Again editing or creating your own Report Templates requires html and css knowledge therefore we assume you are already familiar with these. That being said each <td> is a column within the table and everything between <td> and </td> is the content of that column for that row. Within the <td> there is a class property which we use to define if the column is going to be right or left align along with other possible css styles. For the accounting reports we also now grey out the line if it's NSF as well as include a strike through, therefore to do this we do a check if the Accounting Entry is NSF and if so we apply the nsf style. Specifically we do ${accountingEntry.nsf?then('nsf','')}. What this means is that we check if the entry is NSF with ${accountingEntry.nsf} and if so it will add 'nsf' to the style otherwise leave it as is.
We then proceed to display the data item for that column. For the Date Due field we ${(accountingEntry.dateDue?date)!} This is a bit more complex than just ${accountingEntry.dateDue} but this is because we have to add extra logic just in case the accounting entry has no date for that field (for example the Date Due is empty). The "?date" portion tells the templating engine to expect a date type. The software has additional logic to automatically format any dates to your Date Preference. The parenthesis and ! is to say that if the date is empty (you never entered a Date Due for that entry) then just leave it blank. If the value is simple such as the description column you can just use ${accountingEntry.description}.
To display the amounts in a nicely formatted way, such as 1,000.23 (comma and period) you need to add "?string.@LandlordMaxCurrency" as part of the token, such that you would have ${accountingEntry.amountDue?string.@LandlordMaxCurrency} If you don't include the formatting you will display the amount in pennies.
Since we're trying to get a total at the end of the report we then also want to add the amountDue and amountPaid values to our totals. For the Amount Due we do <#assign amountDueTotal += accountingEntry.amountDue> which basically says add the current Accounting Entry's Amount Due to the amountDueTotal variable.
Finally once all items are displayed we then add one last totals row to the table. Without going into the html/css it is good to change the style for the last row so that you know it's a table. You can use cellspan's, etc. but to keep the reports simpler for people with less html knowledge we decided to just define each column in the Report Templates. In any case this is where we finally display our totals. For the Amount Due we have ${amountDueTotal?string.@LandlordMaxCurrency} As you will quicly see it's just ${amountDueTotal} but with the added formatting information so that it's a currency amount with comma's and the period for the cents portion.
We then finish and close off the table in the html code.
Again this may look complex, especially if you don't know html or css as knowledge of these are assumed, but if not any webpage programmer should be able to assist you. And of course we will be offering consulting services if you prefer we create and/or customize the reports for you directly. As well you can copy a Report Template and just change it rather than try to create your own report to start with.
** Please note that you will need to reload the Reports page to see any changes you make to the Report Templates.
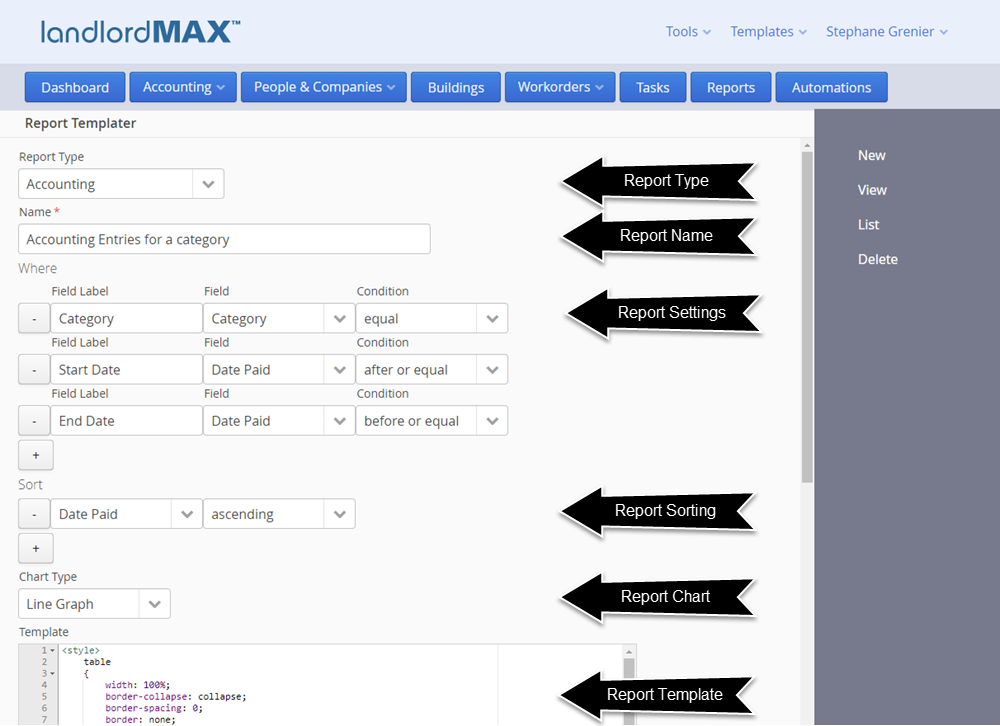
Above is a screenshot of the form view for the Report Template. It is essentially the same as the Data View except this is where you edit all the Report Template settings. Again the Report Template is divided into several different sections as described above. The main thing to notice is that there are + and - buttons for the Where and Sort options, which is so that you can add or remove additional settings as required. So for example the report Accounting Entries for a category for a landlord is essentially the same Report Template except that the Landlord setting is also added as shown in the screenshot below:
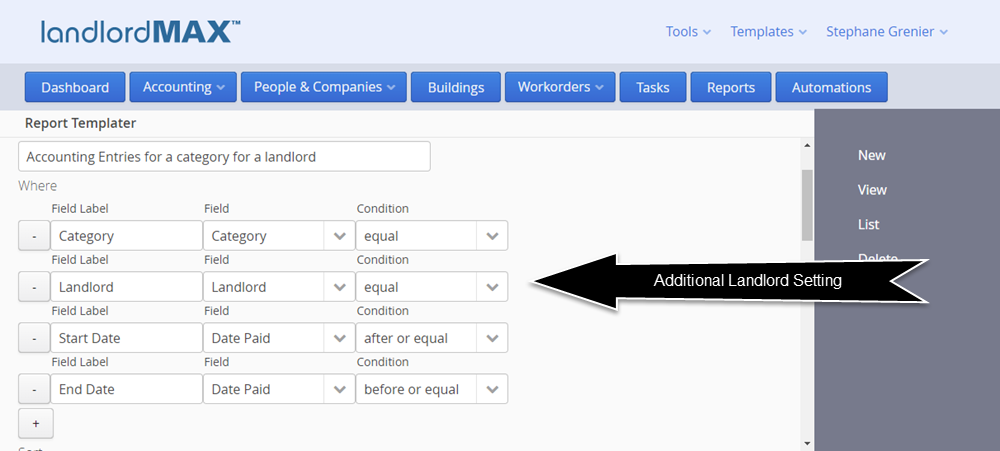
Keep in mind that because the Landlord setting was added to this Report Template that this report is now available under the Automation which will run reports for landlords. The software will automatically realize that you can run this report for a Landlord and add it to the appropriate Automation. If you had added a Tenant then it would be added it to the Automations that runs reports for Tenants.
Please note that the order in the Where Report Settings is the order in which they will appear when you go to run the report. Therefore in the example for the report "Accounting Entries for a category for a landlord" the report screen has the following appearance:
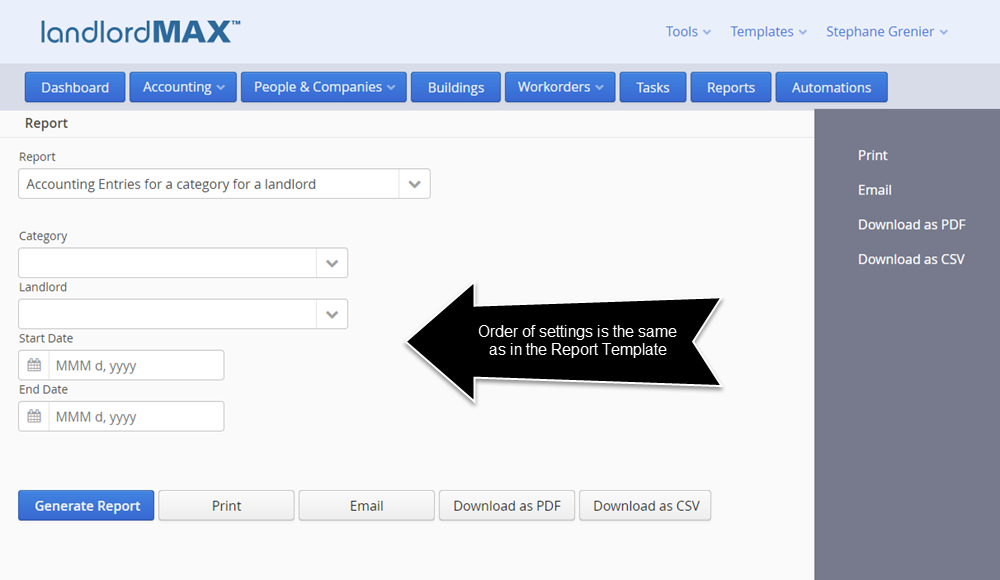
When you don't need to enter in any information for the Report Setting the software will omit it from the Report screen. So for example if you were to create a report called "Accounting entries for this year" and had the Report Setting for the field Date Paid to be "this year" then there is no need to show the date Report Setting because only Accounting Entries for this year are to be included as shown below:
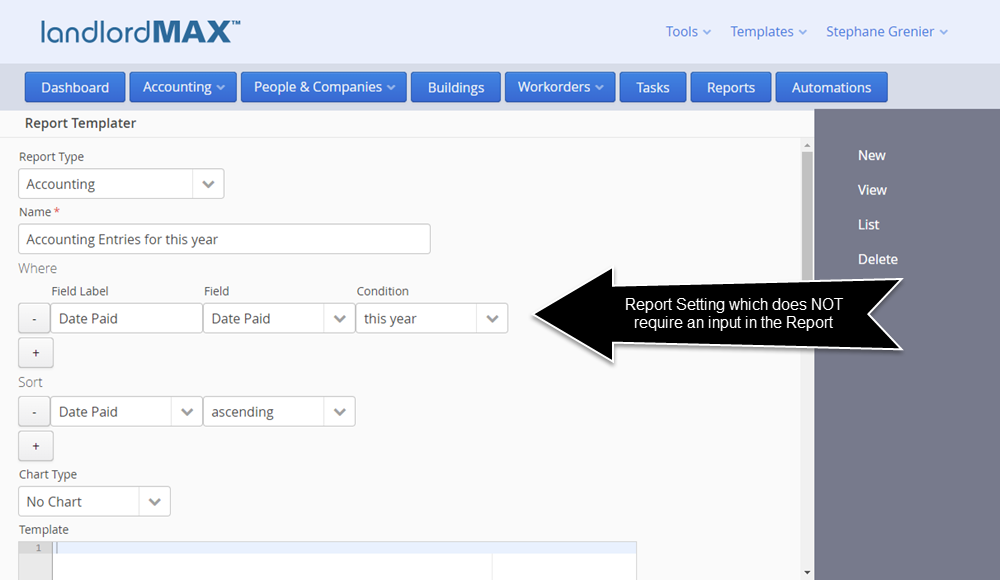
As you can see the custom reporting system is very flexible and allows you to generate all kinds of reports. Different types of reports have different settings, options, and values. The details for each report will be provided in the user manual, and of course you can always look at the existing reports for examples of what is possible. The Copy button takes an existing report and makes a copy for you, which is a good way to start creating a new custom report.
Again please note that it is expected that you have html/css knowledge to be able to edit and create your own custom reports, or that you have someone who can do this assist you.
** IMPORTANT NOTES -> If there is an error in the Report Template you will be presented with an error message when trying to run the report with some information as to what the error is. We strongly recommend you look at these error messages to help debug any Report Template issues. As well please note that if you make a change to a report that you will need to reload the Report itself for the changes to appear in the report.
Miscellaneous
The license has been adjusted to match the new cost structure of the Cloud Edition in that the number of users or computers on which you use the software is no longer limited, you can use the software on any computer and you can create as many users as you wish for your account. This is because the cost structure of the Cloud Edition is directly related to the number of units you manage, and as such the price of the Cloud Edition is based on the number of units. The minimum monthly price is $10/mth.
**Important -> The Units section for multi-unit Buildings is now located under the Building view with the other SubPanels rather than its own section. This was done to simplify the navigation and process and make it more obvious that Units need to be assigned for multi-unit Buildings.
Please note that in the initial release of the Cloud Edition that the User Types from the Installed Edition are not available, all Users are equal within the software. We are expecting to add different levels of Users but they will be different then the User Types in the current installed Editions such as the Soho Edition and higher. We are planning on expanding User Management significantly but the development is still ongoing and as such will be released at a later date.
Please note that the Templates section from the Installed Editions has been omitted from the Cloud Edition. We have done this because we are planning on offering the ability for the software to create documents such as lease agreements based on document templates (much like System Templates and Report Templates). Due to time constraints it was not possible to include this in the initial release of the Cloud Edition but it is expected in the near future. However because this section of the software will be completely overhauled the data from the Installed Editions will not be transfered to the Cloud Edition.
We've added a Timezone setting for your account so that all the scheduled entries can be calculated and generated based on your timezone rather than where our servers are located. As part of transitioning your data we have done our best to select your timezone but we do ask that you confirm the timezone you want was selected. You can always change it in the settings options after the fact.
Lastly I will take a moment to mention that there are also many new small improvements that are not listed here. These include simple things such as adding Notes text boxes on some screens to moving the ability to flag an accounting entry as NSF by clicking on an NSF checkbox rather than entering NSF in the Amount Paid field.
And with that we welcome you to the new Cloud Edition!!! We look forward to hearing your feedback and input on the Cloud Edition.